
The browser viewer Preview
This page shows how to open CodeGraph's browser viewer and what each of its views is for.
The viewer reads a project's existing index and shows it in a browser on your own computer: a symbol with its callers, source and callees side by side, a file's outline, the call path from one function to another, the repository as a map of modules, a type's hierarchy and the code nothing reaches. It is a preview: it is switched off unless you turn it on, and the views may still change.
Open it
CODEGRAPH_UI=1 codegraph ui                # the indexed project you are in
CODEGRAPH_UI=1 codegraph ui ~/code/my-app  # another indexed project
CODEGRAPH_UI=1 codegraph ui --no-open      # print the address; do not open a browser
CODEGRAPH_UI=1 codegraph ui --read-only    # also refuse to save trails
Without CODEGRAPH_UI=1 the command is refused and left out of --help. The viewer listens on 127.0.0.1, on port 4747 or the next free one after it (--port picks one), and stops with Ctrl+C.
It never builds or changes the index: index the project first with codegraph init. The only thing it writes is a trail you choose to save, a walk through the code kept under .codegraph/ui/trails/.
Press Ctrl+K (⌘K on macOS) anywhere to search for a symbol or a file, or to ask for a path such as how does checkout reach tax.
Start
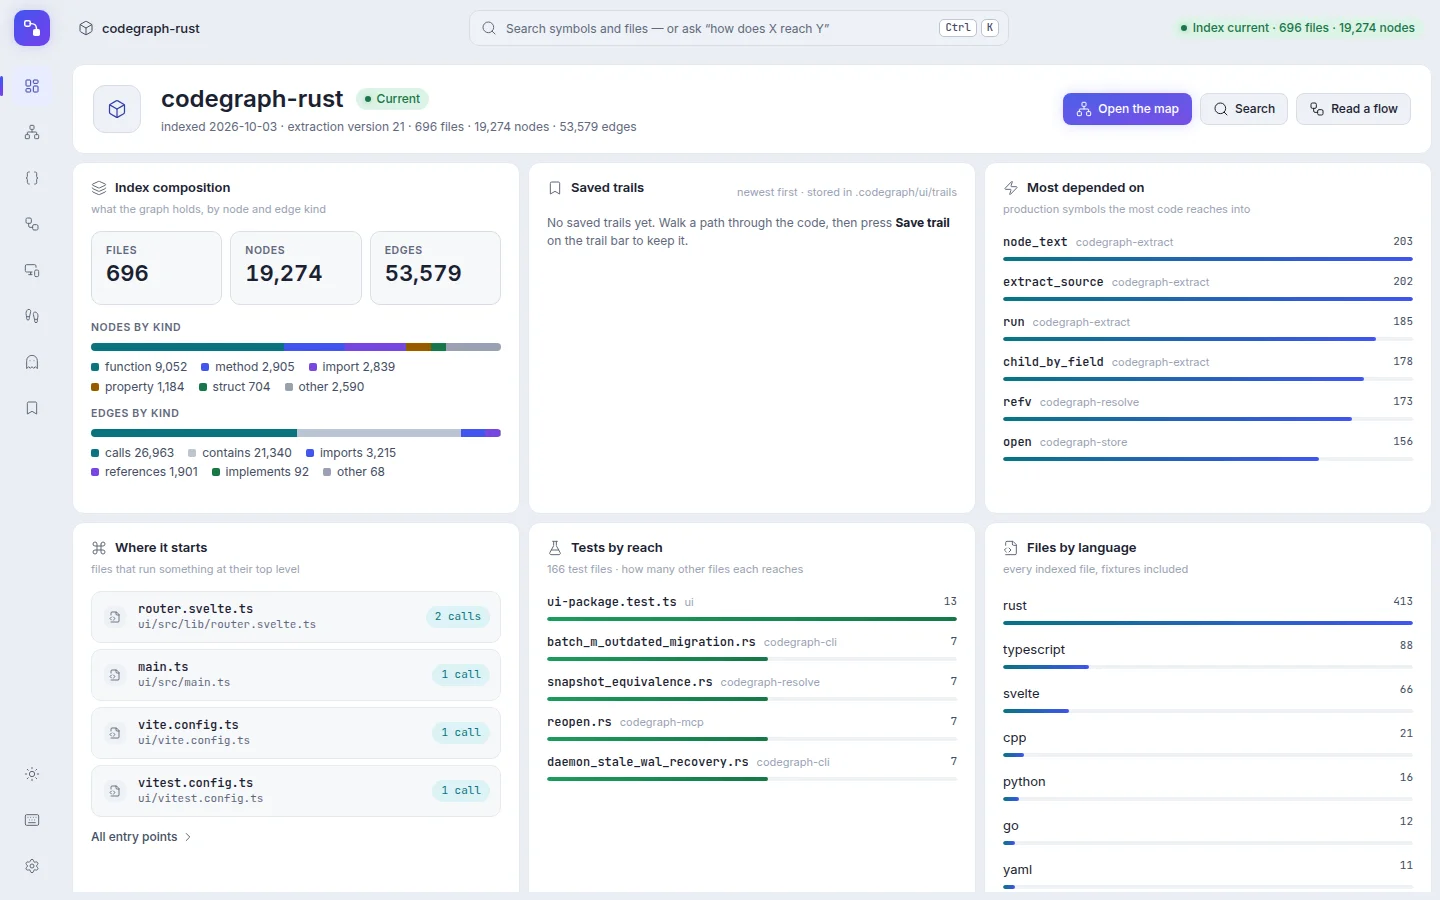
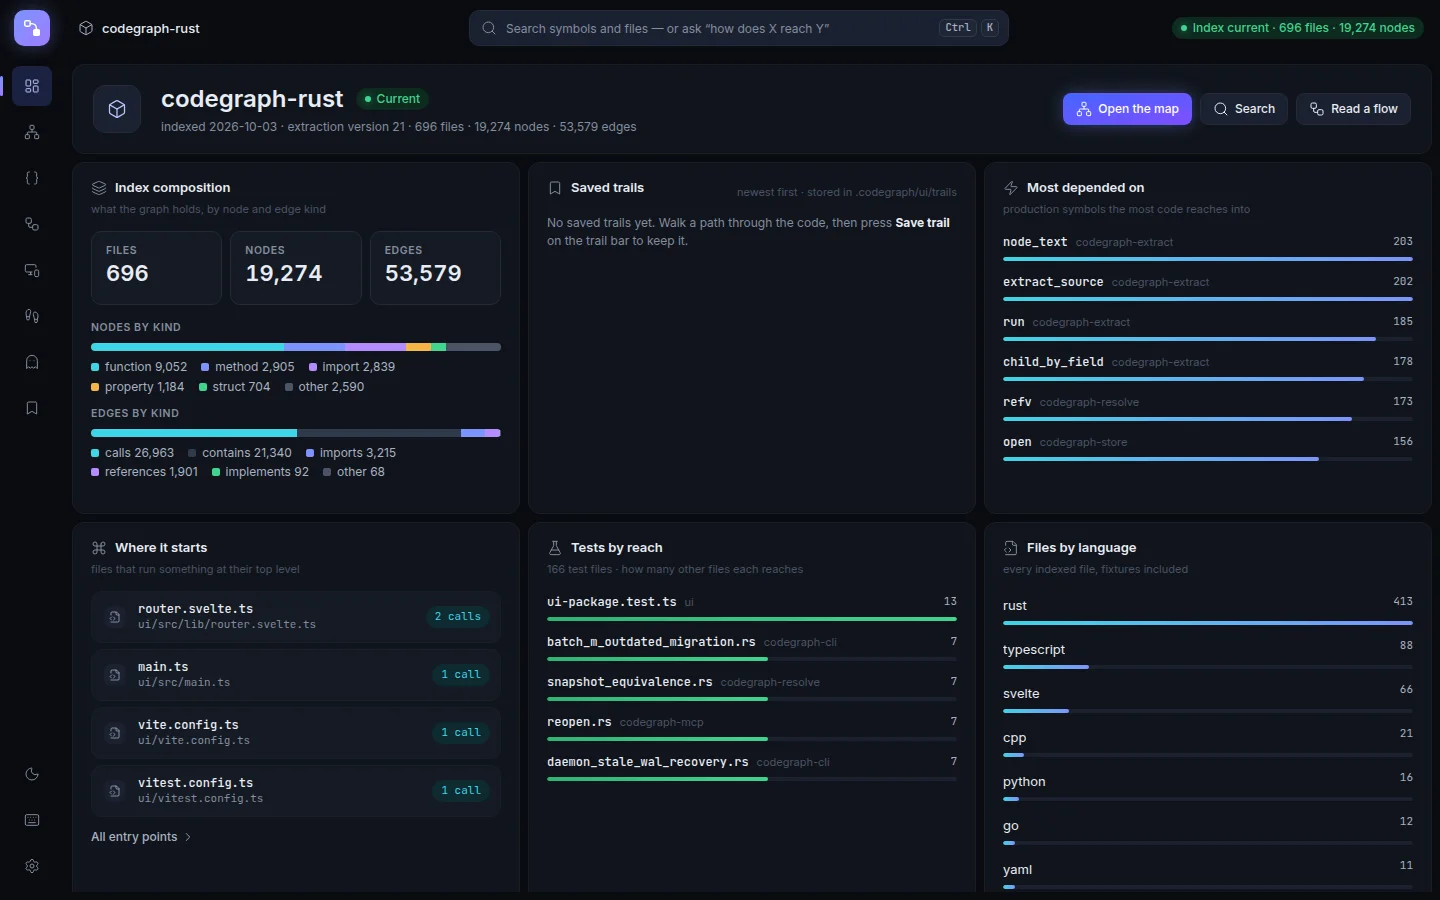
The viewer opens on a start page built from what the index already holds. Under the project name and its index state are three ways in: Open the map, Search and Read a flow. The cards below show:
- what the graph holds, by node and edge kind;
- the trails you saved;
- the production symbols the most code depends on;
- where the code starts: the files that run something at their top level, or the routes when the index holds routes;
- the test files that reach the most other files;
- the indexed files by language.
Every name opens its symbol or file, and All entry points lists every entry point, grouped by file.
Symbol
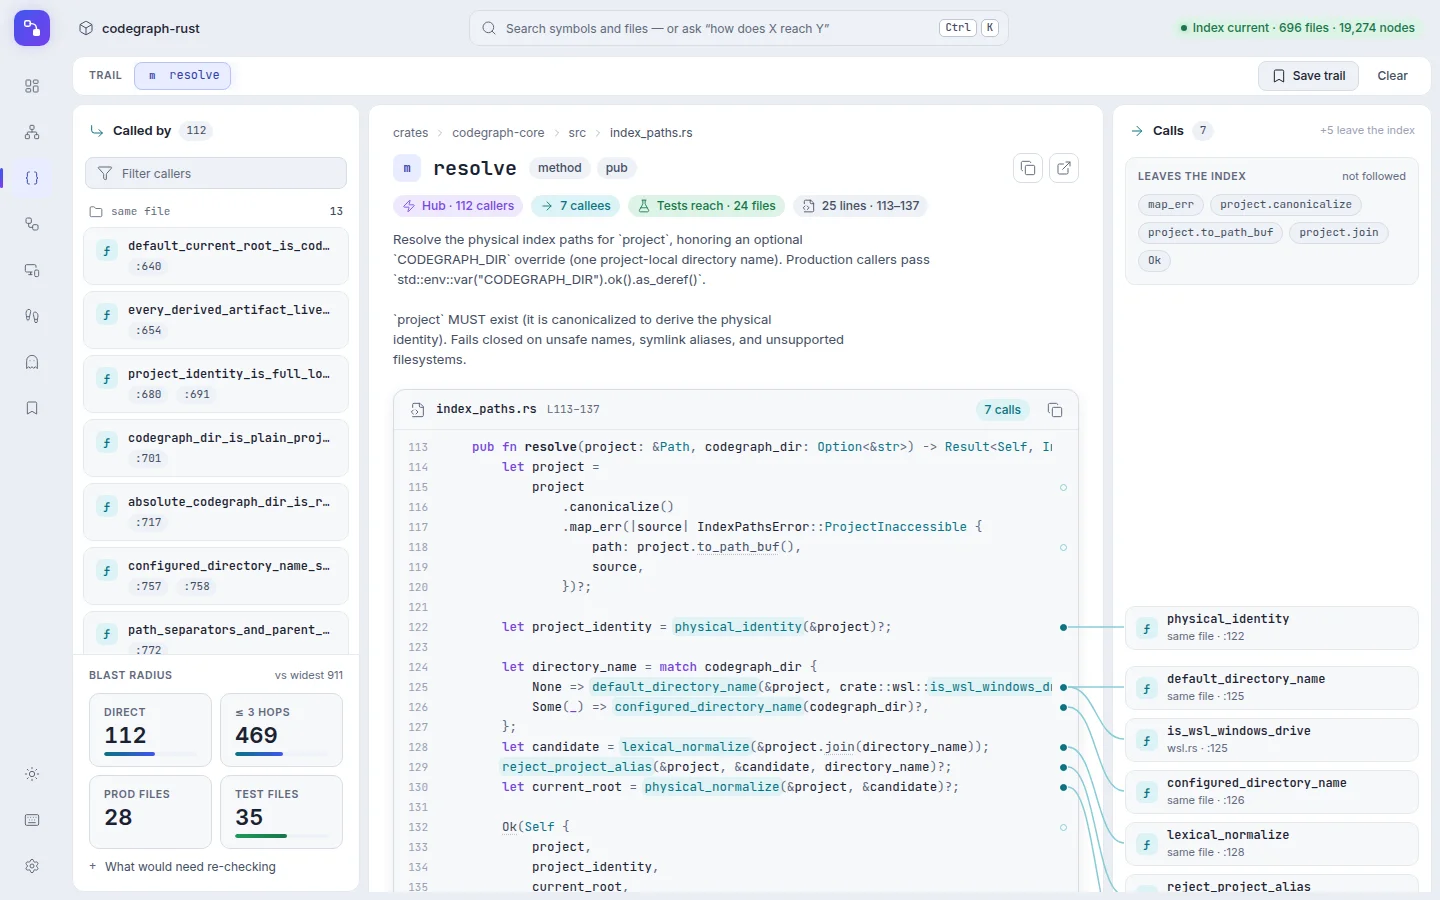
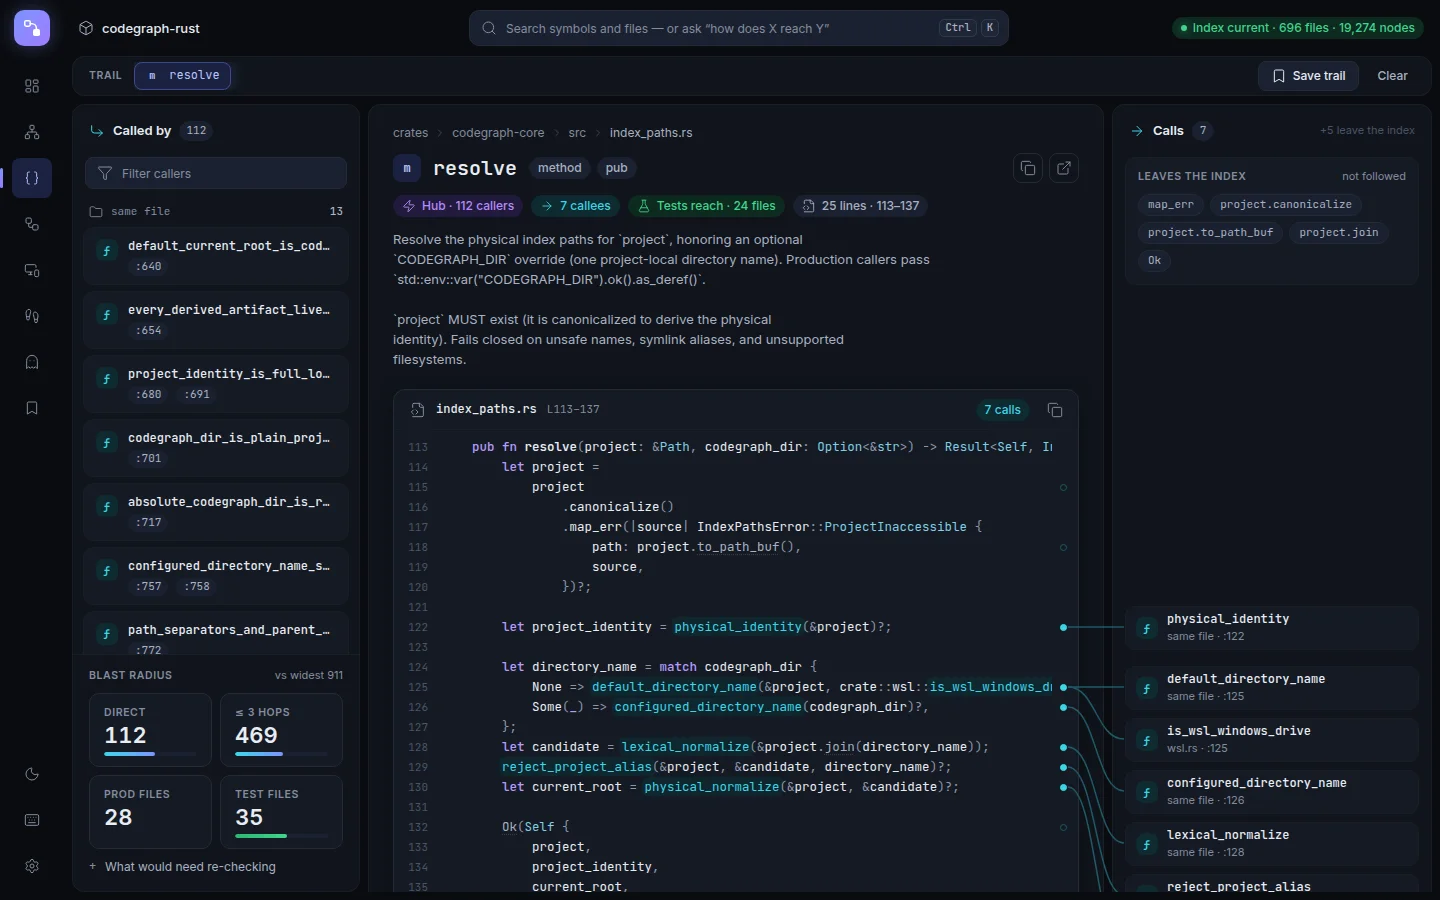
The middle column is the symbol's source, with every call it makes marked in the margin and linked to the column on the right, which lists what it calls. The left column lists its callers, grouped by file. Under them, blast radius counts what a change would reach: direct callers, callers within three hops, and the production and test files among them. Every name opens that symbol, and the trail bar at the top keeps the path you took.
Type hierarchy
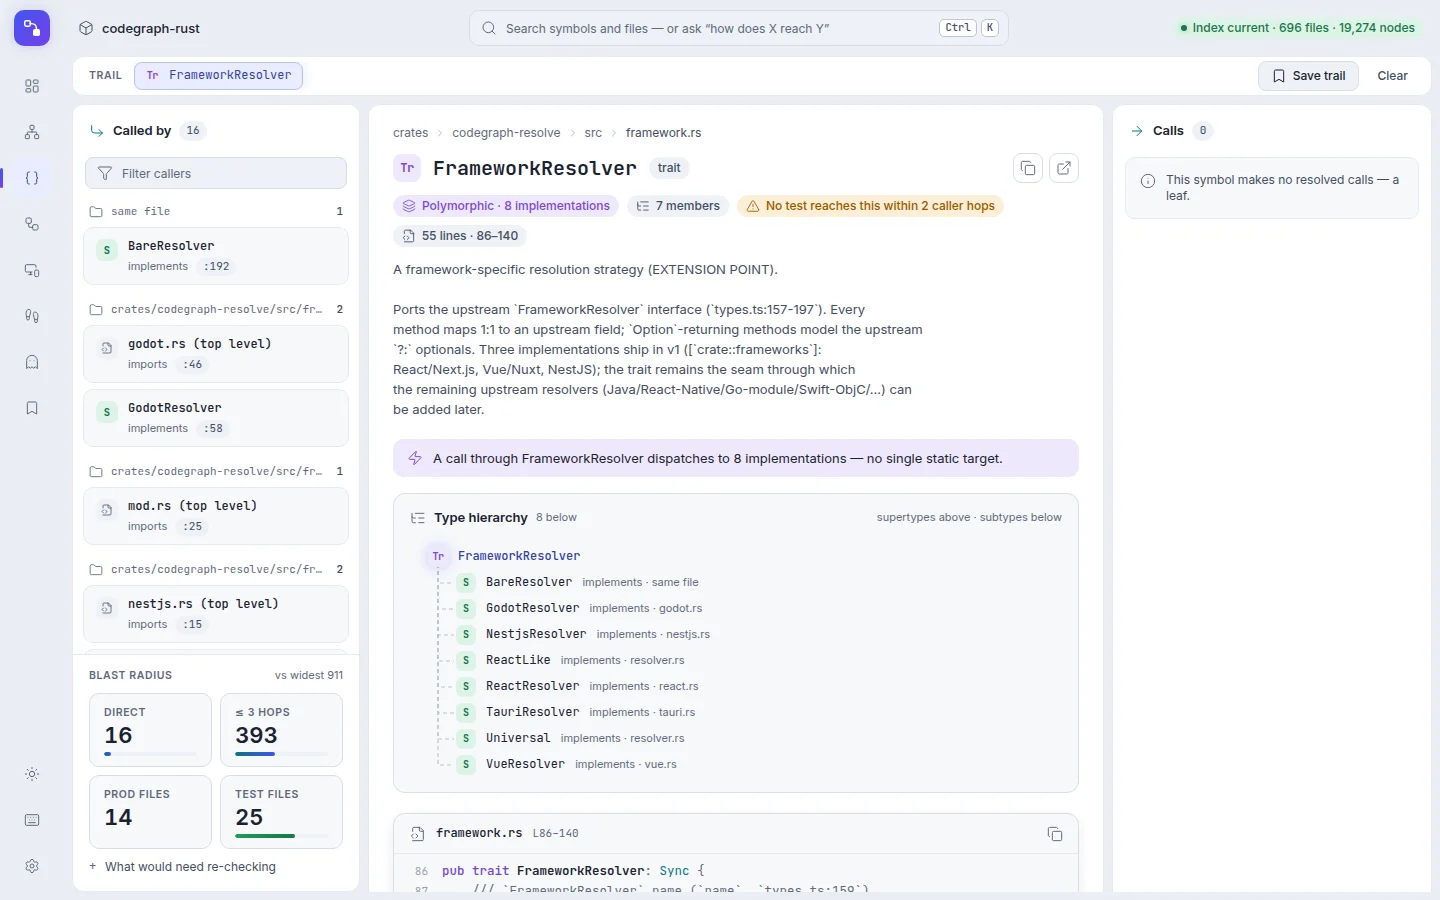
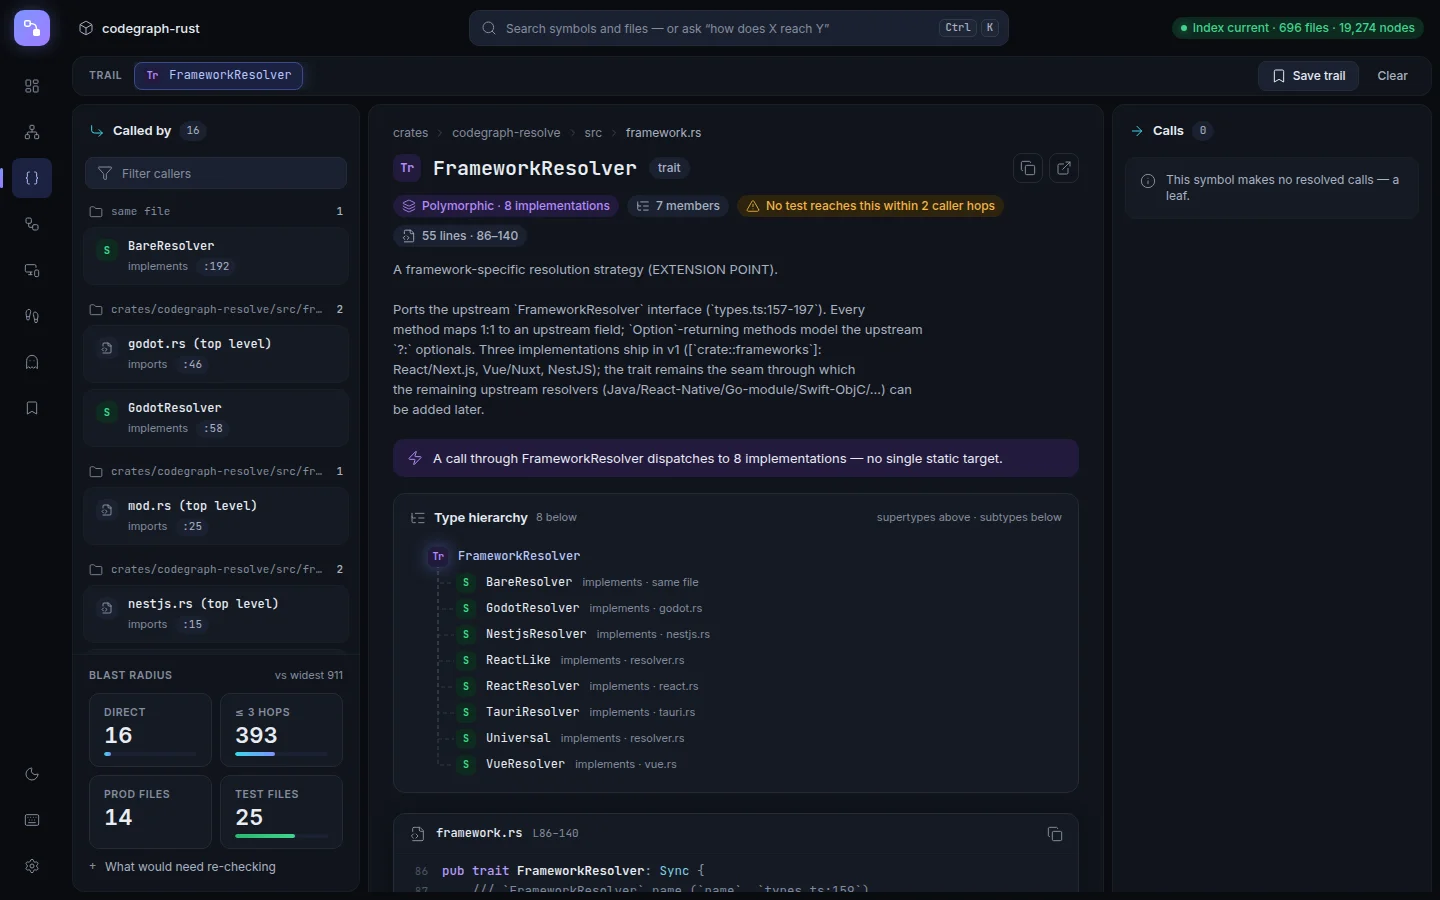
For a class, interface or trait, the Symbol view adds its hierarchy: what it extends and implements above, and what extends or implements it below. A call through such a type is flagged when it dispatches to several implementations, because no single static target exists.
File
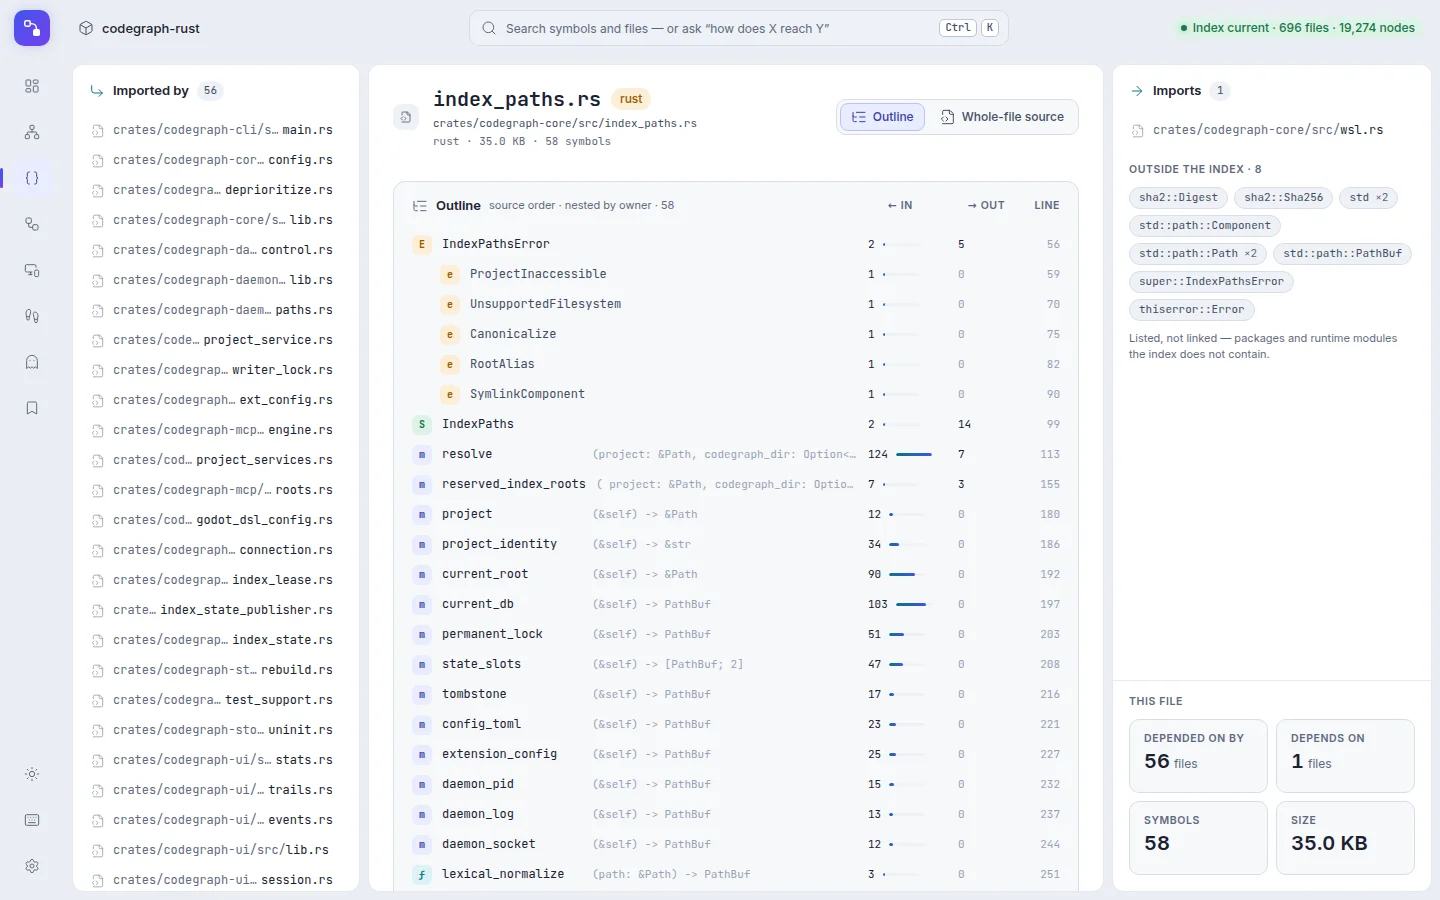
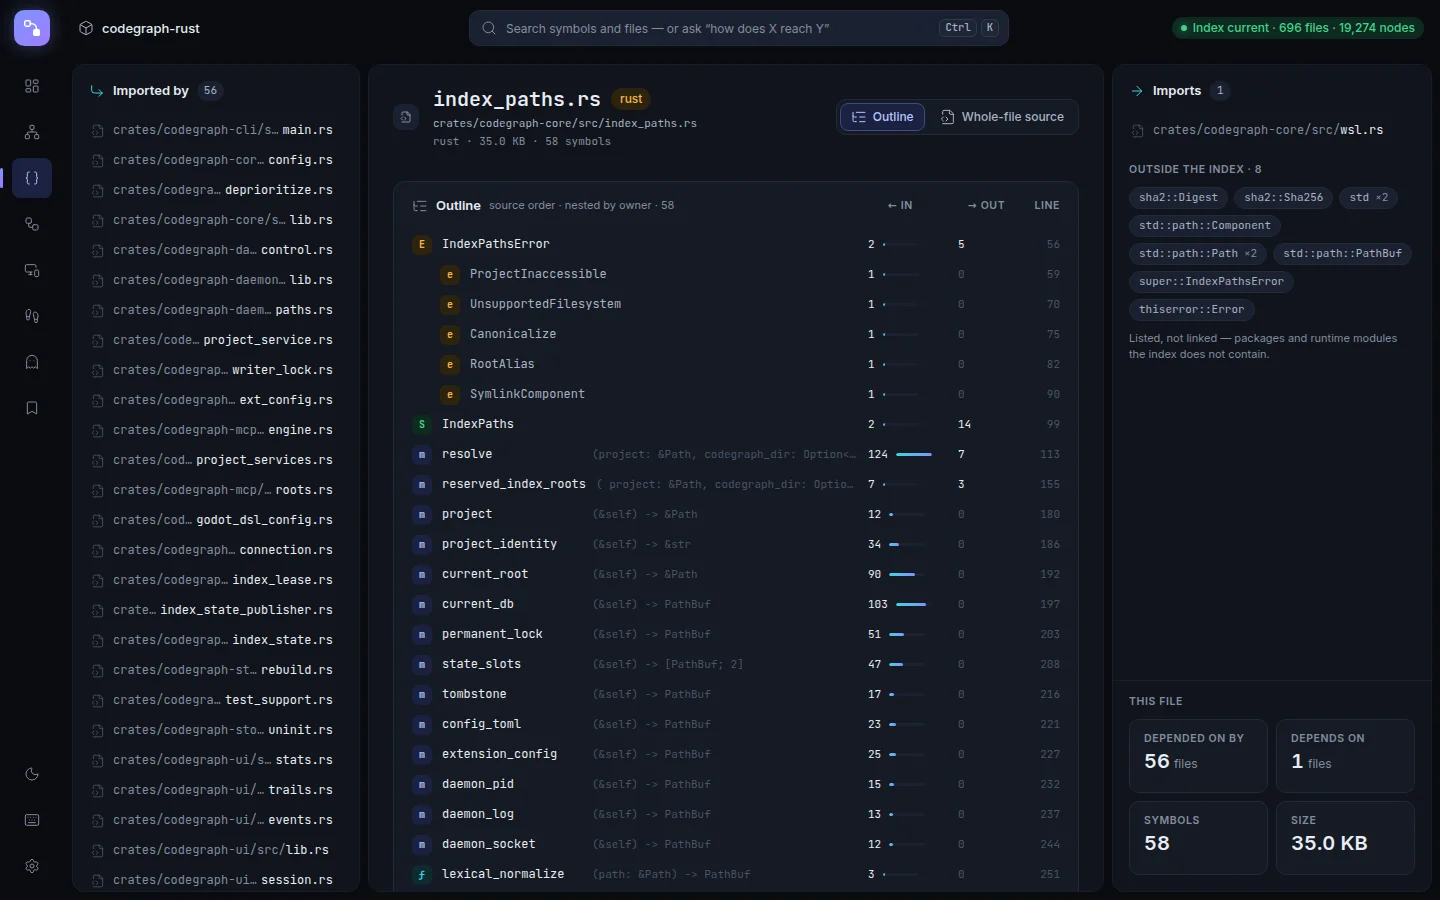
A file's outline lists its symbols in source order with how much points in and out of each. The side columns are the files that import it and the files it imports; names outside the index, such as standard-library paths, are listed but not linked. Whole-file source shows the file line by line with its calls.
Flow
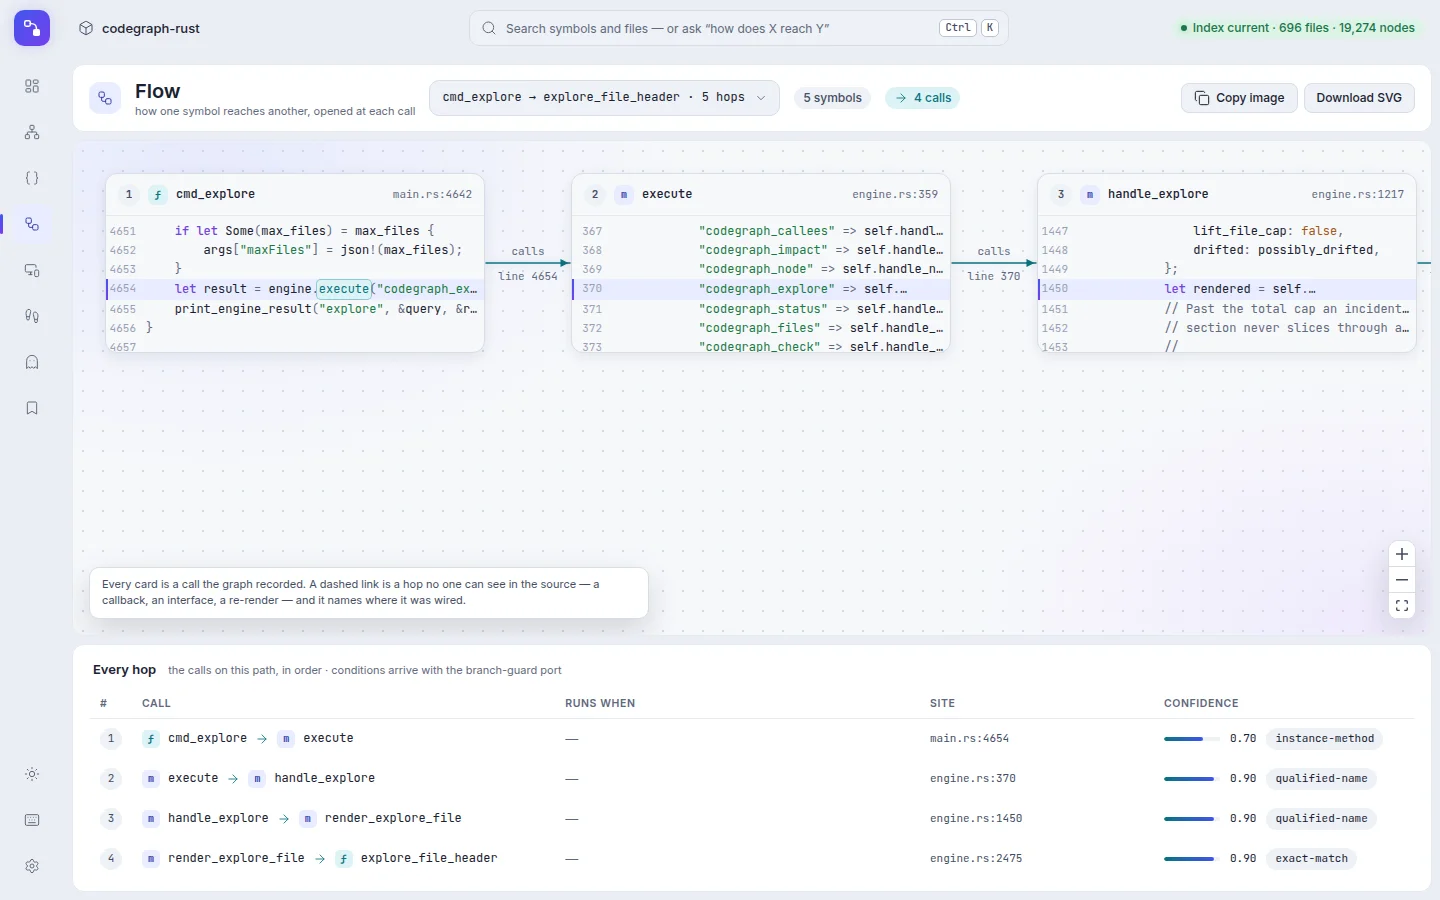
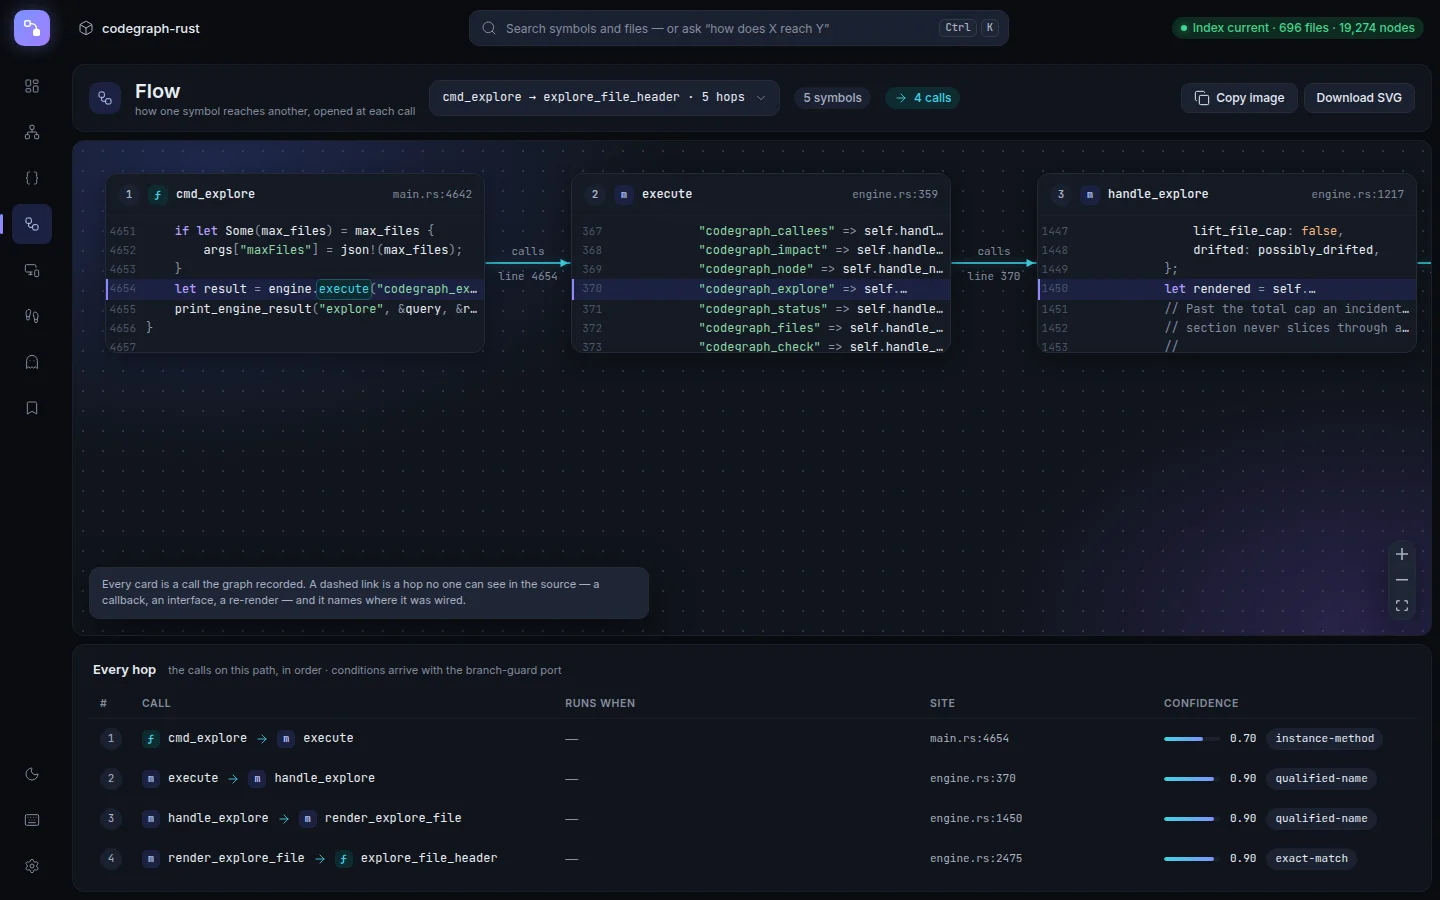
Flow answers "how does A reach B": each card is one hop, opened at the line that makes the next call, and the table below lists every hop with where the call is and how confidently it was resolved. This capture is CodeGraph's own codegraph explore command reaching the engine that also serves the MCP tool. When no chain of calls connects the two, the view says so and names the usual reasons, such as a callback or a reflective call.
Map
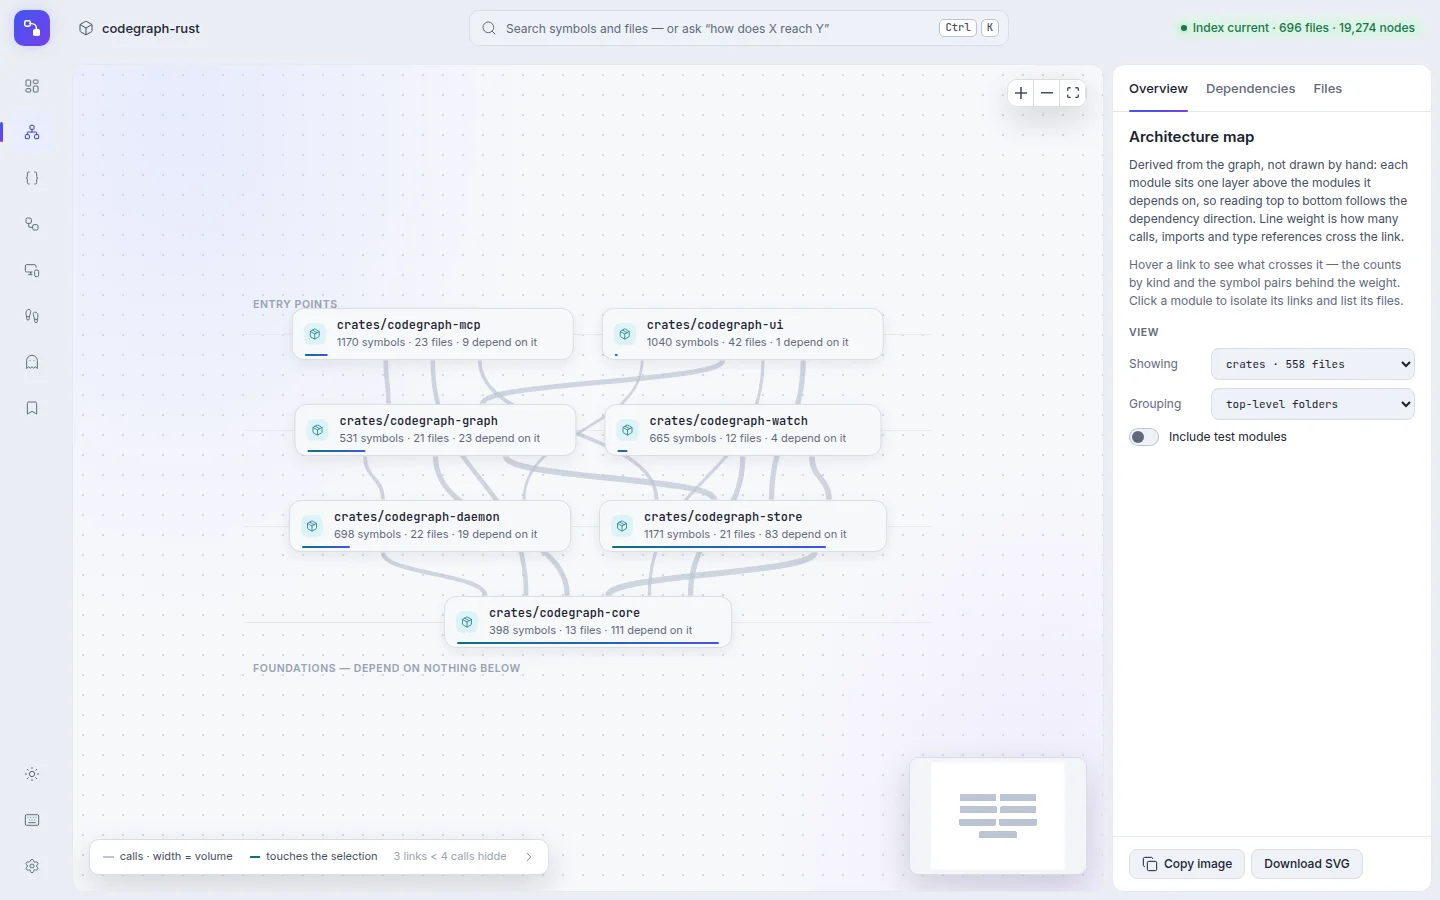
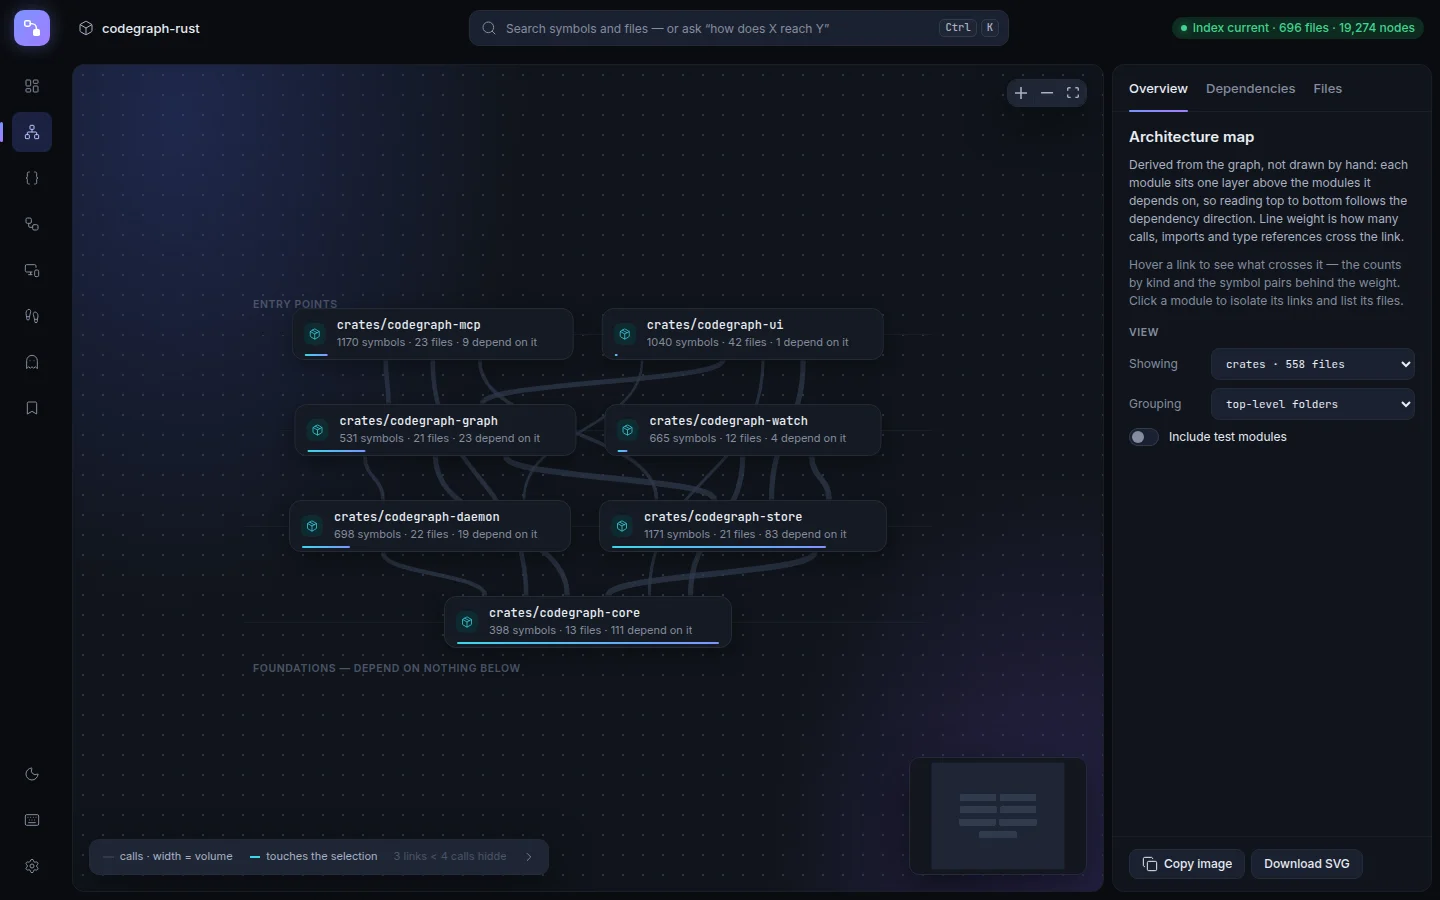
The map groups files into modules and lays them out by dependency: each module sits one layer above the modules it depends on, so the foundations end up at the bottom and the entry points at the top. Line weight is how many calls, imports and type references cross between two modules. Choose the folder and grouping depth on the right; Copy image and Download SVG export the map as drawn.
Dead code
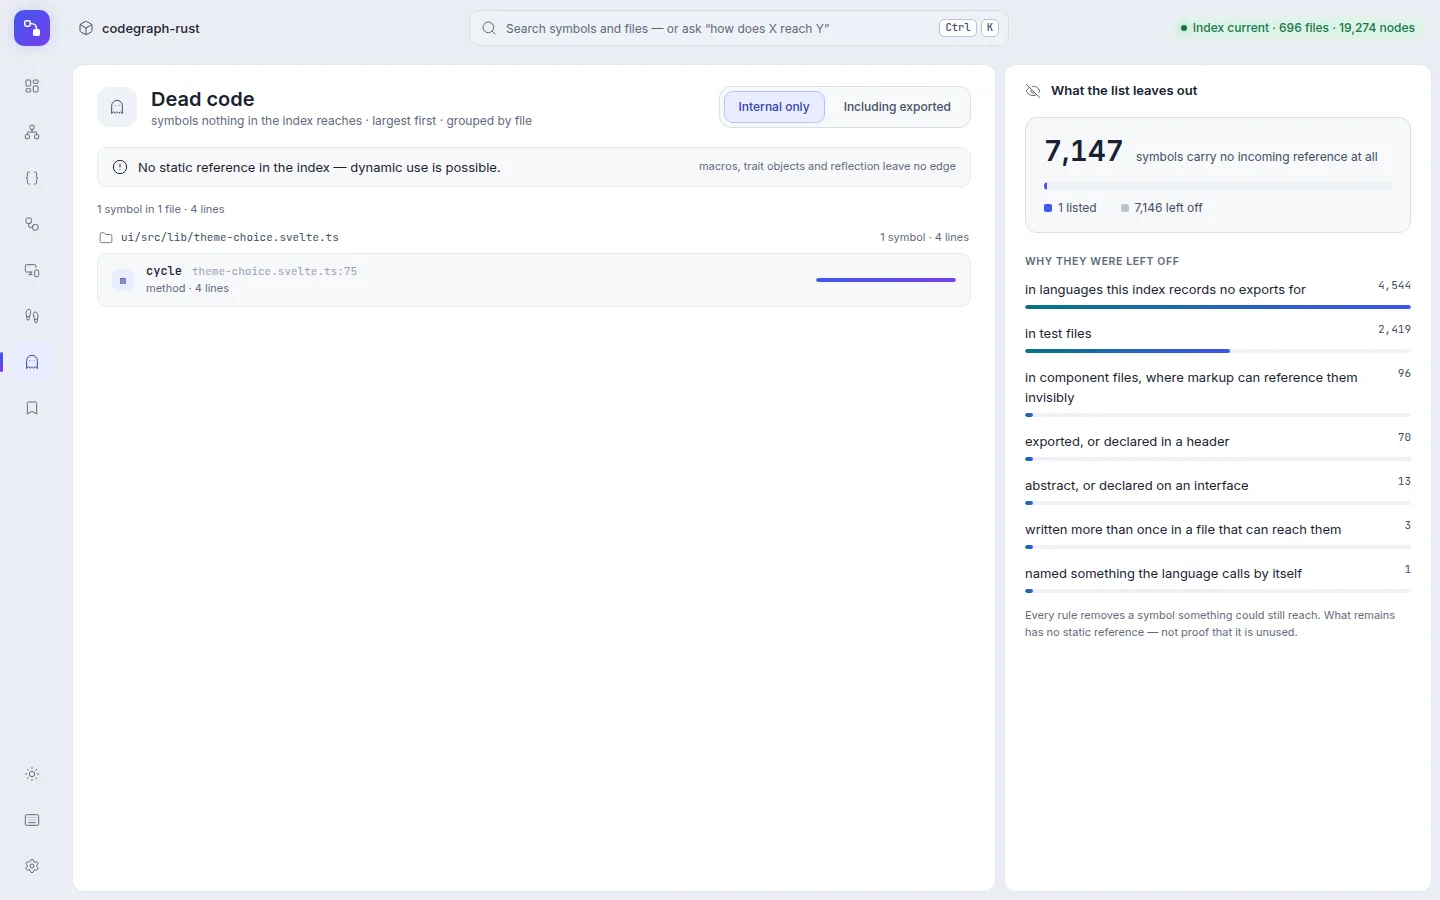
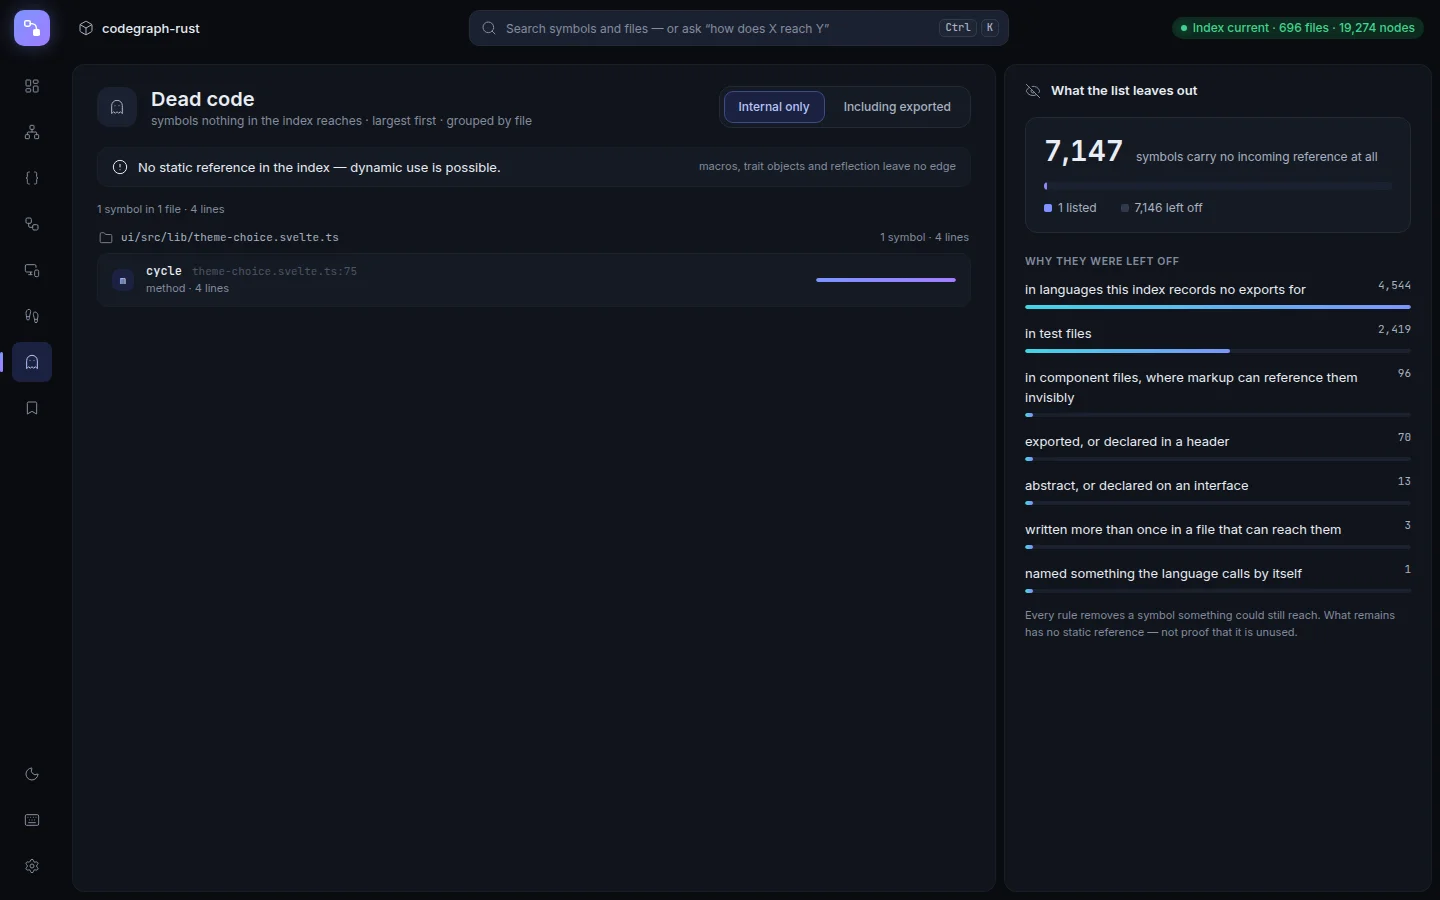
Dead code lists symbols that nothing in the index reaches, largest first. The panel on the right explains what the list leaves out and why: exported symbols, test files, symbols in component files whose markup can reach them, and others. What remains has no static reference, which is not proof that it is unused: macros, trait objects and reflection can still reach it.
Start, entry points, screens and steps
The start page summarises the index: what it holds, the most depended-on symbols, where execution starts, and the tests that reach furthest. Entry points lists those starting places in full, with saved trails first.
Screens and Steps need graph facts this version does not record yet: Screens reports that it found no screen navigation, and Steps says it cannot draw steps. The viewer reference lists what is still missing.
Themes
The viewer follows your system's light or dark setting until you choose one with the theme control at the bottom of the left rail. Below 600 px wide a tab bar replaces the rail, and the Symbol view shows one pane at a time.
How it stays safe
The viewer listens on 127.0.0.1 only. It refuses requests whose Host or Origin is not its own, and writes that lack its header. It opens only files the index names inside the project. The viewer reference lists every check.